Understanding the carbon footprint of the National Health Service in England
Categories: Net zero health systems, GHG emissions assessments, Europe, Low carbon sustainable health systems
Publisher: NHS England
Country: United Kingdom of Great Britain and Northern Ireland
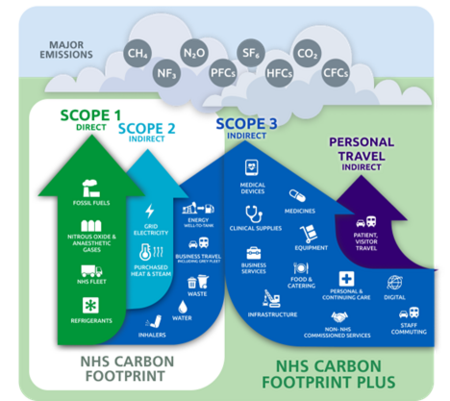 Greenhouse Gas Protocol scopes in the context of the NHS (NHS England, 2025)
 Context
The National Health Service (NHS) in England provides publicly funded health services, delivering over 1.6 million interactions with patients every day. This includes primary and community care, mental health care and hospital care.
In the United Kingdom, climate change has a huge health impact. The impact of this is predicted to be costly to society and the NHS. The total costs of heat-related mortalities from climate change and related socio-economic change in England have been estimated at approximately £6.8 billion per year in the 2020s, rising to £14.7 billion per year in the 2050s. Also, air pollution contributes to up to 38,000 deaths per year. Tackling climate change can be lifesaving, with health benefits gained through cleaner air, improved diets and active travel. Furthermore, 9 in 10 NHS staff support the NHS taking action to reduce its impact on climate change. Overall, there is a clear need and desire for the NHS to understand and reduce its carbon footprint.
In October 2020, the NHS became the world’s first health system to commit to reaching net zero emissions through the publication of the Delivering a net zero NHS strategy. The strategy set two targets against a 1990 baseline:
- Net zero by 2040 for the emissions the NHS controls directly (the NHS Carbon Footprint), with an 80% reduction by 2028 to 2032.
- Net zero by 2045 for the emissions the NHS can influence (the NHS Carbon Footprint Plus), with an ambition to reach an 80% reduction by 2036 to 2039.
In 2020, the NHS published the world’s first comprehensive healthcare system carbon footprint analysis. For many emission sources, this model used an expenditure approach, distributing total NHS expenditure into Standard Industrial Classification (SIC) categories based on Multi-Regional Input Output (MRIO) modelling. These were then multiplied by SIC-level emissions intensities (kgCO2e/£ spent in the relevant industrial sector) for England published by the Department of Environment, Food and Rural Affairs. The work, developed with a team of academics and published in the Lancet Planetary Health journal found that the NHS was responsible for around 4% to 5% of the country’s emissions.
Calculating the NHS carbon footprint and understanding the emissions profile of the NHS has been vital in identifying and prioritising actions to reduce NHS emissions, including from anaesthetic gases, inhalers, and buildings. Thanks to the efforts of NHS staff, NHS Carbon Footprint emissions have decreased by 14% since 2019/20, and over 68% since 1990 – an impressive achievement, and a reflection of the commitment and actions of staff across the country.
Implementation process
The 2020 approach to modelling NHS emissions has since been replicated by other healthcare systems around the world and helps support healthcare professionals, executives and policymakers in understanding where they can make most impact.
The estimates from the ‘Delivering a Net Zero NHS’ Strategy, while world-leading at the time, used an expenditure-based methodology for much of the footprint, and relied on economic modelling to distribute total NHS spend into categories. This limited the ability for the estimates to fully reflect activity, identify variation between organisations and monitor changes over time.
Since 2020, the Greener NHS team has continued to improve its modelling approach by replacing spend-based estimates with new and more granular NHS-specific data wherever possible. Notable improvements include:
- use of monthly prescription data for inhalers and data from suppliers on nitrous oxide volumes supplied to NHS organisations;
- addition of refrigerant emissions;
- use of an annual transport data collection, providing data down to vehicle level fuel consumption and mileage, for fleet emissions;
- use of high-quality financial data from individual NHS organisations as the basis for expenditure modelling.
Overall, this improved understanding of NHS emissions will help to further prioritise and track actions nationally and locally. A full description of the updated methodology (as well as a comparison of data quality between the 2020 and 2025 methodologies) can be found in Five years of a Greener NHS: an improved carbon footprint assessment of the National Health Service in England.
As a result of the methodological improvements, a consistent time series of NHS Carbon Footprint estimates for 2019/20 to 2024/25 has been published in a progress report 5 years on from the original ‘Delivering a Net Zero NHS’ strategy. These estimates are based on granular, NHS specific data, and therefore the 14% reduction demonstrated reflects actual change taking place within the NHS.
The national estimates are now largely built from organisation-level data (particularly for NHS Trusts), using existing data collections and data collected directly from suppliers where possible. This supports better understanding of organisational variation, analysis of drivers of emissions (supporting further policy development and benchmarking) and richer understanding of progress over time. This will help to further prioritise and track actions nationally and locally. Figure 1 shows Carbon Footprint Plus emissions broken down by source, and Figure 2 includes further breakdown.
This analysis has also found that, in the last 5 years, the NHS Carbon Footprint Plus has reduced by 15% per real pound of the NHS budget, and by 7% per finished admission episode (FAE), which suggests the NHS and its suppliers are making progress.


Lessons learned
The following key lessons can be drawn from the NHS England experience:
- Iterative developments have ensured that estimates of NHS emissions remain robust. These developments have included improving data quality, data availability, and using the best available evidence, targeting improved estimates in areas of high emissions or potential for action. This has enabled an improved understanding and more granular breakdown of emissions since 2020, feeding into targeted action and policy development.
- Understanding the carbon footprint of the health system is a vital tool for planning and prioritising approaches to decarbonise activity across healthcare – however having ‘perfect’ data should not delay action. Known actions that reduce emissions should be prioritised
Challenges
- Distributed across over 13,500 acute care, mental health, ambulance, community services and general practice buildings, employing over 1.5 million staff and delivering 1.7 million patient interactions everyday – carbon footprinting the NHS in England is a complex task.
- Identifying and understanding complex and varied scope 3 supply chain emissions is challenging. More in depth supplier data will be vital to further improve modelling for this area of the carbon footprint.
- Improving methodology results in improved estimates that may not match previously published figures. Communicating the reasons for change is important to support proper understanding of progress and avoid unnecessary confusion.
Success factors
- Setting up robust governance approaches is key to continued progress and development. This has included having a Chief Sustainability Officer for the health system, an expert panel consisting of global leaders and experts on this topic, and publication of the methodology to ensure a robust and transparent approach is being taken.
- Developing carbon analytics capability within the national team has been essential for developing and improving the NHS carbon footprint model.
- Developing an understanding of existing consistent and high-quality NHS and UK government datasets, adding additional data collection only where the data does not already exist and the additional reporting burden is justified, has ensured robust basis for the modelling, and high response rates for data collection.
- Communication of the findings of analytic modelling supports the implementation of change by demonstrating the evidence underpinning the case for change and thus driving action. The analysis has also improved understanding of emission hotspots, and allows staff to better understand how their work can have an impact.
Recommendations
- Using the hybrid approach to emissions measurement has enabled meaningful yet practically achievable analysis. Prioritised iterative improvement to data and modelling over time continues to strengthen this approach.
- Collaboration is essential to understanding and calculating GHG emissions from across the health sector.
- Setting up and ongoing upholding of a robust governance and quality assurance approach is vital when undertaking this process.
Key resources
- 5 year progress update
- Academic paper pre-print
- Delivering a ‘Net Zero’ NHS report
- Health care’s response to climate change: a carbon footprint assessment of the NHS in England (Lancet paper)
- Greener NHS website
More information
For more information, please contact the Greener NHS team, NHS England at england.greener.nhs@nhs.net